
Using the Excel Solver To
Optimize Your Marketing
Budget
The Excel Solver allows you to calculate how to allocate your resources to get an optimal result. It is such a useful and versatile tool that almost any manager can put it use effectively but not many are familiar with how to use it.
This article will provide a simple example of how an Internet marketing manager can use the Excel Solver to optimize the allocation of marketing budget funds among 4 pay-per-click networks to achieve the highest number of conversions (sales).
Solver Problem Summary
In summary, here’s what we are trying to do:
1) Maximize the total number of conversions from all 4 pay-per-click vendors.
2) Not spend more than $500 on each individual pay-per-click provider
3) Not spend more than $1,500 total
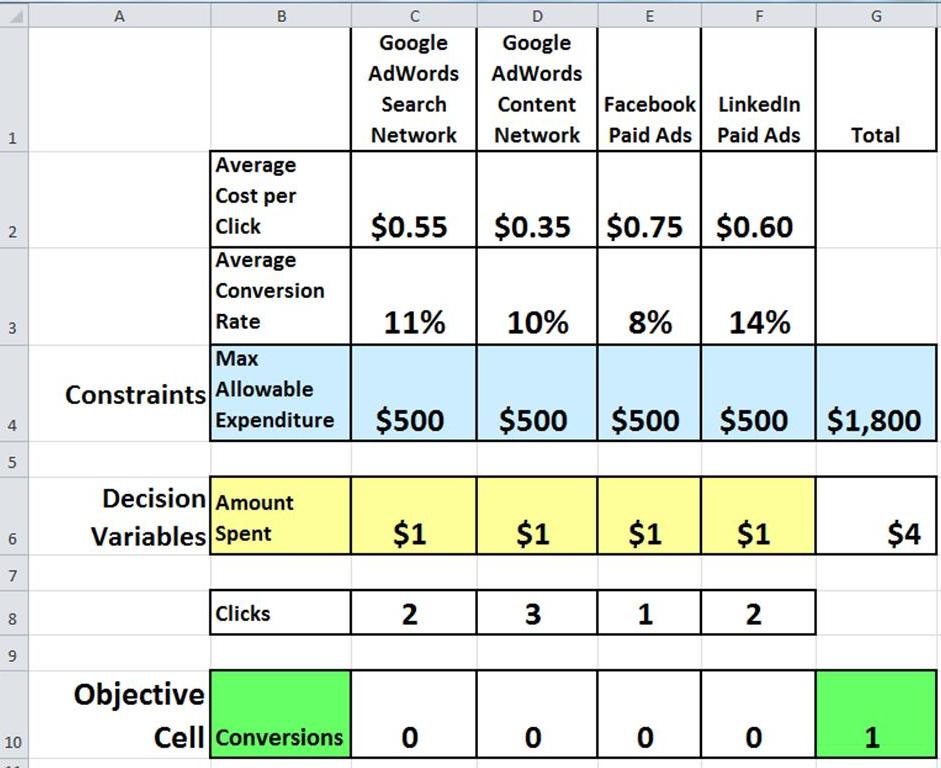
We are also provided with the average cost per click and average conversion rate (percentage of clicks that convert to sales) for each network. The information is placed on a spreadsheet as follows:

Click On the Image To See a Larger Version
Our Solver Optimization Task
We have a total monthly paid search budget of $1,500 that must be allocated between the 4 following paid search providers: Google AdWords Search Network, Google AdWords Content, Facebook paid search, and LinkedIn paid search. We want to keep our pay-per-click efforts diversified; we will spend no more than $500 per month any single pay-per-click providers, but no more than $1500 total.
We know our average cost-per-click and conversion rate for each of the 4 pay-per-click vendors. Conversion rate is the percentage of clicks that convert (buy and become customers).
Running the Problem on the Excel Solver
Once the Solver has been installed as an add-in (To add-in Solver: File / Options / Add-Ins / Manage / Excel Add-Ins / Go / Solver Add-In), you can access the Solver in Excel 2010 by: Data / Solver.
The following blank Solver dialogue box appears:
Click on Image To See Larger Version
2) Whether we want to minimize or maximize the target, or attempt to achieve a certain value in the Objective cell.

Maximize the total number of conversions from all 4 pay-per-click vendors (green cell H10)
Decision Variables:
By varying the budget amounts allocated to each of the 4 pay-per-click networks (tan cells – C6 to F6)
 Click on Image To See Larger Version

The Solver dialogue box has the following 5 parameters that need to be set:
1) The Objective Cell – The is the target cell that we are either trying to maximize, minimize, or achieve a certain value.
2) Whether we want to minimize or maximize the target, or attempt to achieve a certain value in the Objective cell.
3) Decision Variables – A set of variables that will be changed by the Excel Solver in order to optimize the target cell.
4) Constraints – These are the limitations that the problem subjects the Solver to during its calculations
5) Solving Method to be used.
Here once again is the Excel spreadsheet input data that will be used:
Here once again is the Excel spreadsheet input data that will be used:
Click On Image To See Larger Version
Objective:
Maximize the total number of conversions from all 4 pay-per-click vendors (green cell H10)
Decision Variables:
By varying the budget amounts allocated to each of the 4 pay-per-click networks (tan cells – C6 to F6)
Objective and Decision Variables Selected in Solver
Choice of Solver Method

Click on Image To See Larger Version
a1x1 + a2x2 + … + anxn = objective
We can tell that we are dealing entirely with linear equations in this example because all equations which used to determine the objective (the final number of conversions) are first-order. These basic equations are as follows:
Number of Clicks = (Average Cost Per Click) * (Amount Spent)
Number of Conversions = (Average Conversion Rate) * (Number of Clicks)
The GRG Nonlinear method is used when the equation producing the objective is not linear but is smooth (continuous). Examples of smooth nonlinear functions are:
The Evolutionary method is used for non-smooth functions. These are functions whose graph is discontinuous at any point.
The use of the GRG Nonlinear and Evolutionary methods would require much more discussion than time permits in this article. We will therefore work exclusively with the Simplex LP method here.
Constraints
Constraints must be added separately. To add a new constraint, just click the Add button and select the cell that will have the constraints applied to it. You then select the type of constraint, for example, the constrained cell must be less than a certain number. Finally you specify the constraining value, for example, the number that the constrained variable must be less than.
When setting constraints, it is important to remember which variables cannot take a negative number and then specify this as a constraint. In this case, the Amount Spent for any of the pay-per-click networks cannot take a negative value.
The constraint highlighted in blue ( $C$4:$F$4 Greater Than or Equal To 0) illustrates this type of constraint in this example:
a1x1 + a2x2 + … + anxn = objective
We can tell that we are dealing entirely with linear equations in this example because all equations which used to determine the objective (the final number of conversions) are first-order. These basic equations are as follows:
Number of Clicks = (Average Cost Per Click) * (Amount Spent)
Number of Conversions = (Average Conversion Rate) * (Number of Clicks)
The GRG Nonlinear method is used when the equation producing the objective is not linear but is smooth (continuous). Examples of smooth nonlinear functions are:
=1/C1, =Log(C1), and =C1^2
These functions have graphs that are curved (nonlinear), but have no breaks (smooth)
These functions have graphs that are curved (nonlinear), but have no breaks (smooth)
The Evolutionary method is used for non-smooth functions. These are functions whose graph is discontinuous at any point.
The use of the GRG Nonlinear and Evolutionary methods would require much more discussion than time permits in this article. We will therefore work exclusively with the Simplex LP method here.
Constraints
Constraints must be added separately. To add a new constraint, just click the Add button and select the cell that will have the constraints applied to it. You then select the type of constraint, for example, the constrained cell must be less than a certain number. Finally you specify the constraining value, for example, the number that the constrained variable must be less than.
When setting constraints, it is important to remember which variables cannot take a negative number and then specify this as a constraint. In this case, the Amount Spent for any of the pay-per-click networks cannot take a negative value.
The constraint highlighted in blue ( $C$4:$F$4 Greater Than or Equal To 0) illustrates this type of constraint in this example:

Click On Image To See Larger Version

Solve

Close-Up of Constraints Input Into Solver

Click On Image To See Larger Version
Solve
You are now ready to hit the Solve button and get the final result. Solver changes the Decision Variables to optimize the Objective Cell. When Solver changes the Decision Variables, all other variables which depend upon these Decision Variables will be recalculated. By definition, the Objective Cell must be a variable that is derived from the Decision Variables. The end result of running the Solver are as follows:

Click On Image To See Larger Version
Final, Optimized Result
Constraints Satisfied
Available Reports

Final, Optimized Result
We can see that the Excel Solver calculated the maximum possible number of conversions to be 392. Solver did this by setting the Decision Variables as follows:
Amount Spent – Google AdWords Search: $500
Amount Spent – Google AdWords Content: $500
Amount Spent – Facebook Paid Ads: $300
Amount Spent – LinkedIn Paid Ads: $500
Constraints Satisfied
The constraints on the upper limits of each Amount Spent, Total Amount Spent, and non-negative constraint for each Amount Spent have all been satisfied.
Available Reports
There are 3 available reports that can be attached to the Solver’s result. These 3 reports are Answer, Sensitivity, and Limits as seen in the Solver Completion dialogue box below:

Click On Image To See Larger Version
We will briefly evaluate only a part of 1 of those reports in this article: the Sensitivity Report.
The Sensitivity Report

We will briefly evaluate only a part of 1 of those reports in this article: the Sensitivity Report.
The Sensitivity Report
Part of the Sensitivity Report is shown below:

Click On Image To See Larger Version
= Total Number of Conversions
We can see from the Objective Coefficients that an amount spent on the Google AdWords Content Network would have the greatest effect on the Total Number of Conversions.
Summary
The Excel Solver at its basic level is a simple tool to use to determine the optimal allocation of your available resources.
If you would like to create a link to this blog article, here is the link to copy for your convenience:
Using Solver To Optimize Your Marketing Budget

The Objective Function column shows the coefficients for each Amount Spent to produce the Total Number of Conversions. Since this is a first-order equation, the result looks like this:
0.2 * (Amount Spent on Google AdWords Search) +
0.2857143 * (Amount Spent on Google AdWords Content) +
0.1066667 * (Amount Spent on Facebook Paid Ads) +
0.2333333 * (Amount Spent on LinkedIn Paid Ads) =
= Total Number of Conversions
We can see from the Objective Coefficients that an amount spent on the Google AdWords Content Network would have the greatest effect on the Total Number of Conversions.
Summary
The Excel Solver at its basic level is a simple tool to use to determine the optimal allocation of your available resources.
If you would like to create a link to this blog article, here is the link to copy for your convenience:
Using Solver To Optimize Your Marketing Budget
Please post any comments you have on this article. Your opinion is highly valued!
If You Like This, Then Share It...
Excel Master Series Blog Directory
Statistical Topics and Articles In Each Topic
- Histograms in Excel
- Bar Chart in Excel
- Combinations & Permutations in Excel
- Normal Distribution in Excel
- Overview of the Normal Distribution
- Normal Distribution’s PDF (Probability Density Function) in Excel 2010 and Excel 2013
- Normal Distribution’s CDF (Cumulative Distribution Function) in Excel 2010 and Excel 2013
- Solving Normal Distribution Problems in Excel 2010 and Excel 2013
- Overview of the Standard Normal Distribution in Excel 2010 and Excel 2013
- An Important Difference Between the t and Normal Distribution Graphs
- The Empirical Rule and Chebyshev’s Theorem in Excel – Calculating How Much Data Is a Certain Distance From the Mean
- Demonstrating the Central Limit Theorem In Excel 2010 and Excel 2013 In An Easy-To-Understand Way
- t-Distribution in Excel
- Binomial Distribution in Excel
- z-Tests in Excel
- t-Tests in Excel
- Overview of t-Tests: Hypothesis Tests that Use the t-Distribution
- 1-Sample t-Tests in Excel
- Overview of the 1-Sample t-Test in Excel 2010 and Excel 2013
- Excel Normality Testing For the 1-Sample t-Test in Excel 2010 and Excel 2013
- 1-Sample t-Test – Effect Size in Excel 2010 and Excel 2013
- 1-Sample t-Test Power With G*Power Utility
- Wilcoxon Signed-Rank Test As a 1-Sample t-Test Alternative in Excel 2010 and Excel 2013
- Sign Test As a 1-Sample t-Test Alternative in Excel 2010 and Excel 2013
- 2-Independent-Sample Pooled t-Tests in Excel
- Overview of 2-Independent-Sample Pooled t-Test in Excel 2010 and Excel 2013
- Excel Variance Tests: Levene’s, Brown-Forsythe, and F Test For 2-Sample Pooled t-Test in Excel 2010 and Excel 2013
- Excel Normality Tests Kolmogorov-Smirnov, Anderson-Darling, and Shapiro Wilk Tests For Two-Sample Pooled t-Test
- Two-Independent-Sample Pooled t-Test - All Excel Calculations
- 2-Sample Pooled t-Test – Effect Size in Excel 2010 and Excel 2013
- 2-Sample Pooled t-Test Power With G*Power Utility
- Mann-Whitney U Test in Excel as 2-Sample Pooled t-Test Nonparametric Alternative in Excel 2010 and Excel 2013
- 2-Sample Pooled t-Test = Single-Factor ANOVA With 2 Sample Groups
- 2-Independent-Sample Unpooled t-Tests in Excel
- 2-Independent-Sample Unpooled t-Test in Excel 2010 and Excel 2013
- Variance Tests: Levene’s Test, Brown-Forsythe Test, and F-Test in Excel For 2-Sample Unpooled t-Test
- Excel Normality Tests Kolmogorov-Smirnov, Anderson-Darling, and Shapiro-Wilk For 2-Sample Unpooled t-Test
- 2-Sample Unpooled t-Test Excel Calculations, Formulas, and Tools
- Effect Size for a 2-Independent-Sample Unpooled t-Test in Excel 2010 and Excel 2013
- Test Power of a 2-Independent Sample Unpooled t-Test With G-Power Utility
- Paired (2-Sample Dependent) t-Tests in Excel
- Paired t-Test in Excel 2010 and Excel 2013
- Excel Normality Testing of Paired t-Test Data
- Paired t-Test Excel Calculations, Formulas, and Tools
- Paired t-Test – Effect Size in Excel 2010, and Excel 2013
- Paired t-Test – Test Power With G-Power Utility
- Wilcoxon Signed-Rank Test As a Paired t-Test Alternative
- Sign Test in Excel As A Paired t-Test Alternative
- Hypothesis Tests of Proportion in Excel
- Hypothesis Tests of Proportion Overview (Hypothesis Testing On Binomial Data)
- 1-Sample Hypothesis Test of Proportion in Excel 2010 and Excel 2013
- 2-Sample Pooled Hypothesis Test of Proportion in Excel 2010 and Excel 2013
- How To Build a Much More Useful Split-Tester in Excel Than Google's Website Optimizer
- Chi-Square Independence Tests in Excel
- Chi-Square Goodness-Of-Fit Tests in Excel
- F Tests in Excel
- Correlation in Excel
- Pearson Correlation in Excel
- Spearman Correlation in Excel
- Confidence Intervals in Excel
- Overview of z-Based Confidence Intervals of a Population Mean in Excel 2010 and Excel 2013
- t-Based Confidence Intervals of a Population Mean in Excel 2010 and Excel 2013
- Minimum Sample Size to Limit the Size of a Confidence interval of a Population Mean
- Confidence Interval of Population Proportion in Excel 2010 and Excel 2013
- Min Sample Size of Confidence Interval of Proportion in Excel 2010 and Excel 2013
- Simple Linear Regression in Excel
- Overview of Simple Linear Regression in Excel 2010 and Excel 2013
- Simple Linear Regression Example in Excel 2010 and Excel 2013
- Residual Evaluation For Simple Regression in Excel 2010 and Excel 2013
- Residual Normality Tests in Excel – Kolmogorov-Smirnov Test, Anderson-Darling Test, and Shapiro-Wilk Test For Simple Linear Regression
- Evaluation of Simple Regression Output For Excel 2010 and Excel 2013
- All Calculations Performed By the Simple Regression Data Analysis Tool in Excel 2010 and Excel 2013
- Prediction Interval of Simple Regression in Excel 2010 and Excel 2013
- Multiple Linear Regression in Excel
- Basics of Multiple Regression in Excel 2010 and Excel 2013
- Multiple Linear Regression Example in Excel 2010 and Excel 2013
- Multiple Linear Regression’s Required Residual Assumptions
- Normality Testing of Residuals in Excel 2010 and Excel 2013
- Evaluating the Excel Output of Multiple Regression
- Estimating the Prediction Interval of Multiple Regression in Excel
- Regression - How To Do Conjoint Analysis Using Dummy Variable Regression in Excel
- Logistic Regression in Excel
- Logistic Regression Overview
- Logistic Regression Performed in Excel 2010 and Excel 2013
- R Square For Logistic Regression Overview
- Excel R Square Tests: Nagelkerke, Cox and Snell, and Log-Linear Ratio in Excel 2010 and Excel 2013
- Likelihood Ratio Is Better Than Wald Statistic To Determine if the Variable Coefficients Are Significant For Excel 2010 and Excel 2013
- Excel Classification Table: Logistic Regression’s Percentage Correct of Predicted Results in Excel 2010 and Excel 2013
- Hosmer-Lemeshow Test in Excel – Logistic Regression Goodness-of-Fit Test in Excel 2010 and Excel 2013
- Single-Factor ANOVA in Excel
- Overview of Single-Factor ANOVA
- Single-Factor ANOVA Example in Excel 2010 and Excel 2013
- Shapiro-Wilk Normality Test in Excel For Each Single-Factor ANOVA Sample Group
- Kruskal-Wallis Test Alternative For Single Factor ANOVA in Excel 2010 and Excel 2013
- Levene’s and Brown-Forsythe Tests in Excel For Single-Factor ANOVA Sample Group Variance Comparison
- Single-Factor ANOVA - All Excel Calculations
- Overview of Post-Hoc Testing For Single-Factor ANOVA
- Tukey-Kramer Post-Hoc Test in Excel For Single-Factor ANOVA
- Games-Howell Post-Hoc Test in Excel For Single-Factor ANOVA
- Overview of Effect Size For Single-Factor ANOVA
- ANOVA Effect Size Calculation Eta Squared (?2) in Excel 2010 and Excel 2013
- ANOVA Effect Size Calculation Psi (?) – RMSSE – in Excel 2010 and Excel 2013
- ANOVA Effect Size Calculation Omega Squared (?2) in Excel 2010 and Excel 2013
- Power of Single-Factor ANOVA Test Using Free Utility G*Power
- Welch’s ANOVA Test in Excel Substitute For Single-Factor ANOVA When Sample Variances Are Not Similar
- Brown-Forsythe F-Test in Excel Substitute For Single-Factor ANOVA When Sample Variances Are Not Similar
- Two-Factor ANOVA With Replication in Excel
- Two-Factor ANOVA With Replication in Excel 2010 and Excel 2013
- Variance Tests: Levene’s and Brown-Forsythe For 2-Factor ANOVA in Excel 2010 and Excel 2013
- Shapiro-Wilk Normality Test in Excel For 2-Factor ANOVA With Replication
- 2-Factor ANOVA With Replication Effect Size in Excel 2010 and Excel 2013
- Excel Post Hoc Tukey’s HSD Test For 2-Factor ANOVA With Replication
- 2-Factor ANOVA With Replication – Test Power With G-Power Utility
- Scheirer-Ray-Hare Test Alternative For 2-Factor ANOVA With Replication
- Two-Factor ANOVA Without Replication in Excel
- Creating Interactive Graphs of Statistical Distributions in Excel
- Interactive Statistical Distribution Graph in Excel 2010 and Excel 2013
- Interactive Graph of the Normal Distribution in Excel 2010 and Excel 2013
- Interactive Graph of the Chi-Square Distribution in Excel 2010 and Excel 2013
- Interactive Graph of the t-Distribution in Excel 2010 and Excel 2013
- Interactive Graph of the Binomial Distribution in Excel 2010 and Excel 2013
- Interactive Graph of the Exponential Distribution in Excel 2010 and Excel 2013
- Interactive Graph of the Beta Distribution in Excel 2010 and Excel 2013
- Interactive Graph of the Gamma Distribution in Excel 2010 and Excel 2013
- Interactive Graph of the Poisson Distribution in Excel 2010 and Excel 2013
- Solving Problems With Other Distributions in Excel
- Solving Uniform Distribution Problems in Excel 2010 and Excel 2013
- Solving Multinomial Distribution Problems in Excel 2010 and Excel 2013
- Solving Exponential Distribution Problems in Excel 2010 and Excel 2013
- Solving Beta Distribution Problems in Excel 2010 and Excel 2013
- Solving Gamma Distribution Problems in Excel 2010 and Excel 2013
- Solving Poisson Distribution Problems in Excel 2010 and Excel 2013
- Optimization With Excel Solver
- Maximizing Lead Generation With Excel Solver
- Minimizing Cutting Stock Waste With Excel Solver
- Optimal Investment Selection With Excel Solver
- Minimizing the Total Cost of Shipping From Multiple Points To Multiple Points With Excel Solver
- Knapsack Loading Problem in Excel Solver – Optimizing the Loading of a Limited Compartment
- Optimizing a Bond Portfolio With Excel Solver
- Travelling Salesman Problem in Excel Solver – Finding the Shortest Path To Reach All Customers
- Chi-Square Population Variance Test in Excel
- Analyzing Data With Pivot Tables
- SEO Functions in Excel
- Time Series Analysis in Excel


