
Regression Analysis
Done in Excel
How To Read the Output
There is a lot more to the Excel Regression output than just the regression equation. If you know how to quickly read the output of a Regression done in, you’ll know right away the most important points of a regression: if the overall regression was a good, whether this output could have occurred by chance, whether or not all of the independent input variables were good predictors, and whether residuals show a pattern (which means there’s a problem).
Excel Regression Output With Color-Coding Added
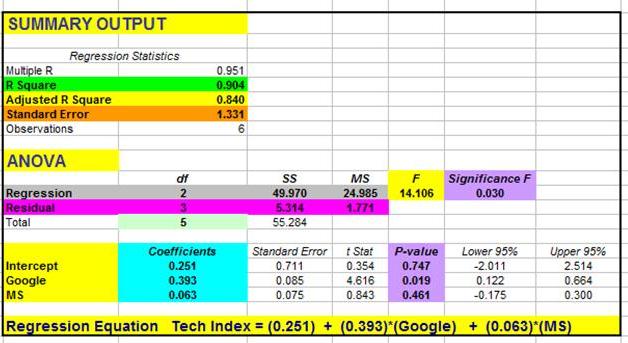
Click On Image To See Enlarged View
This video will illustrate exactly how to quickly and easily understand the output of Regression performed in Excel:
Step-By-Step Video About How To Quickly Read and Understand the Output of Excel Regression
(Is Your Sound Turned On?)
The 4 Most Important Parts of Regression Output
1) Overall Regression Equation’s Accuracy
(R Square and Adjusted R Square)
2) Probability That This Output Was Not By Chance
(ANOVA – Significance of F)
3) Individual Regression Coefficient and Y-Intercept Accuracy
4) Visual Analysis of Residuals
Some parts of the Excel Regression output are much more important than others. The goal here is for you to be able to glance at the Excel Regression output and immediately understand it, so we will focus our attention only on the four most important parts of the Excel regression output.

Click On Image To See Enlarged View
R Square– This is the most important number of the output. R Square tells how well the regression line approximates the real data. This number tells you how much of the output variable’s variance is explained by the input variables’ variance. Ideally we would like to see this at least 0.6 (60%) or 0.7 (70%).
Adjusted R Square – This is quoted most often when explaining the accuracy of the regression equation. Adjusted R Square is more conservative the R Square because it is always less than R Square. Another reason that Adjusted R Square is quoted more often is that when new input variables are added to the Regression analysis, Adjusted R Square increases only when the new input variable makes the Regression equation more accurate (improves the Regression equations’s ability to predict the output). R Square always goes up when a new variable is added, whether or not the new input variable improves the Regression equation’s accuracy.
2) Probability That This Output Was Not By Chance

Click On Image To See Enlarged View
Significance of F – This indicates the probability that the Regression output could have been obtained by chance. A small Significance of F confirms the validity of the Regression output. For example, if Significance of F = 0.030, there is only a 3% chance that the Regression output was merely a chance occurrence.
3) Individual Regression Coefficient Accuracy

Click On Image To See Enlarged View
P-value of each coefficient and the Y-intercept – The P-Values of each of these provide the likelihood that they are real results and did not occur by chance. The lower the P-Value, the higher the likelihood that that coefficient or Y-Intercept is valid. For example, a P-Value of 0.016 for a regression coefficient indicates that there is only a 1.6% chance that the result occurred only as a result of chance.
4) Visual Analysis of Residuals
Charting the Residuals

Click On Image To See Enlarged View
The Residual Chart

Click On Image To See Enlarged View
The residuals are the difference between the Regression’s predicted value and the actual value of the output variable. You can quickly plot the Residuals on a scatterplot chart. Look for patterns in the scatterplot. The more random (without patterns) and centered around zero the residuals appear to be, the more likely it is that the Regression equation is valid.
There are many other pieces of information in the Excel regression output but the above four items will give a quick read on the validity of your Regression.

If anyone has any comments or observations related to this article, feel free to submit them because your input and opinions are highly valued.
If You Like This, Then Share It...
Excel Master Series Blog Directory
Statistical Topics and Articles In Each Topic
- Histograms in Excel
- Bar Chart in Excel
- Combinations & Permutations in Excel
- Normal Distribution in Excel
- Overview of the Normal Distribution
- Normal Distribution’s PDF (Probability Density Function) in Excel 2010 and Excel 2013
- Normal Distribution’s CDF (Cumulative Distribution Function) in Excel 2010 and Excel 2013
- Solving Normal Distribution Problems in Excel 2010 and Excel 2013
- Overview of the Standard Normal Distribution in Excel 2010 and Excel 2013
- An Important Difference Between the t and Normal Distribution Graphs
- The Empirical Rule and Chebyshev’s Theorem in Excel – Calculating How Much Data Is a Certain Distance From the Mean
- Demonstrating the Central Limit Theorem In Excel 2010 and Excel 2013 In An Easy-To-Understand Way
- t-Distribution in Excel
- Binomial Distribution in Excel
- z-Tests in Excel
- t-Tests in Excel
- Overview of t-Tests: Hypothesis Tests that Use the t-Distribution
- 1-Sample t-Tests in Excel
- Overview of the 1-Sample t-Test in Excel 2010 and Excel 2013
- Excel Normality Testing For the 1-Sample t-Test in Excel 2010 and Excel 2013
- 1-Sample t-Test – Effect Size in Excel 2010 and Excel 2013
- 1-Sample t-Test Power With G*Power Utility
- Wilcoxon Signed-Rank Test As a 1-Sample t-Test Alternative in Excel 2010 and Excel 2013
- Sign Test As a 1-Sample t-Test Alternative in Excel 2010 and Excel 2013
- 2-Independent-Sample Pooled t-Tests in Excel
- Overview of 2-Independent-Sample Pooled t-Test in Excel 2010 and Excel 2013
- Excel Variance Tests: Levene’s, Brown-Forsythe, and F Test For 2-Sample Pooled t-Test in Excel 2010 and Excel 2013
- Excel Normality Tests Kolmogorov-Smirnov, Anderson-Darling, and Shapiro Wilk Tests For Two-Sample Pooled t-Test
- Two-Independent-Sample Pooled t-Test - All Excel Calculations
- 2-Sample Pooled t-Test – Effect Size in Excel 2010 and Excel 2013
- 2-Sample Pooled t-Test Power With G*Power Utility
- Mann-Whitney U Test in Excel as 2-Sample Pooled t-Test Nonparametric Alternative in Excel 2010 and Excel 2013
- 2-Sample Pooled t-Test = Single-Factor ANOVA With 2 Sample Groups
- 2-Independent-Sample Unpooled t-Tests in Excel
- 2-Independent-Sample Unpooled t-Test in Excel 2010 and Excel 2013
- Variance Tests: Levene’s Test, Brown-Forsythe Test, and F-Test in Excel For 2-Sample Unpooled t-Test
- Excel Normality Tests Kolmogorov-Smirnov, Anderson-Darling, and Shapiro-Wilk For 2-Sample Unpooled t-Test
- 2-Sample Unpooled t-Test Excel Calculations, Formulas, and Tools
- Effect Size for a 2-Independent-Sample Unpooled t-Test in Excel 2010 and Excel 2013
- Test Power of a 2-Independent Sample Unpooled t-Test With G-Power Utility
- Paired (2-Sample Dependent) t-Tests in Excel
- Paired t-Test in Excel 2010 and Excel 2013
- Excel Normality Testing of Paired t-Test Data
- Paired t-Test Excel Calculations, Formulas, and Tools
- Paired t-Test – Effect Size in Excel 2010, and Excel 2013
- Paired t-Test – Test Power With G-Power Utility
- Wilcoxon Signed-Rank Test As a Paired t-Test Alternative
- Sign Test in Excel As A Paired t-Test Alternative
- Hypothesis Tests of Proportion in Excel
- Hypothesis Tests of Proportion Overview (Hypothesis Testing On Binomial Data)
- 1-Sample Hypothesis Test of Proportion in Excel 2010 and Excel 2013
- 2-Sample Pooled Hypothesis Test of Proportion in Excel 2010 and Excel 2013
- How To Build a Much More Useful Split-Tester in Excel Than Google's Website Optimizer
- Chi-Square Independence Tests in Excel
- Chi-Square Goodness-Of-Fit Tests in Excel
- F Tests in Excel
- Correlation in Excel
- Pearson Correlation in Excel
- Spearman Correlation in Excel
- Confidence Intervals in Excel
- Overview of z-Based Confidence Intervals of a Population Mean in Excel 2010 and Excel 2013
- t-Based Confidence Intervals of a Population Mean in Excel 2010 and Excel 2013
- Minimum Sample Size to Limit the Size of a Confidence interval of a Population Mean
- Confidence Interval of Population Proportion in Excel 2010 and Excel 2013
- Min Sample Size of Confidence Interval of Proportion in Excel 2010 and Excel 2013
- Simple Linear Regression in Excel
- Overview of Simple Linear Regression in Excel 2010 and Excel 2013
- Simple Linear Regression Example in Excel 2010 and Excel 2013
- Residual Evaluation For Simple Regression in Excel 2010 and Excel 2013
- Residual Normality Tests in Excel – Kolmogorov-Smirnov Test, Anderson-Darling Test, and Shapiro-Wilk Test For Simple Linear Regression
- Evaluation of Simple Regression Output For Excel 2010 and Excel 2013
- All Calculations Performed By the Simple Regression Data Analysis Tool in Excel 2010 and Excel 2013
- Prediction Interval of Simple Regression in Excel 2010 and Excel 2013
- Multiple Linear Regression in Excel
- Basics of Multiple Regression in Excel 2010 and Excel 2013
- Multiple Linear Regression Example in Excel 2010 and Excel 2013
- Multiple Linear Regression’s Required Residual Assumptions
- Normality Testing of Residuals in Excel 2010 and Excel 2013
- Evaluating the Excel Output of Multiple Regression
- Estimating the Prediction Interval of Multiple Regression in Excel
- Regression - How To Do Conjoint Analysis Using Dummy Variable Regression in Excel
- Logistic Regression in Excel
- Logistic Regression Overview
- Logistic Regression Performed in Excel 2010 and Excel 2013
- R Square For Logistic Regression Overview
- Excel R Square Tests: Nagelkerke, Cox and Snell, and Log-Linear Ratio in Excel 2010 and Excel 2013
- Likelihood Ratio Is Better Than Wald Statistic To Determine if the Variable Coefficients Are Significant For Excel 2010 and Excel 2013
- Excel Classification Table: Logistic Regression’s Percentage Correct of Predicted Results in Excel 2010 and Excel 2013
- Hosmer-Lemeshow Test in Excel – Logistic Regression Goodness-of-Fit Test in Excel 2010 and Excel 2013
- Single-Factor ANOVA in Excel
- Overview of Single-Factor ANOVA
- Single-Factor ANOVA Example in Excel 2010 and Excel 2013
- Shapiro-Wilk Normality Test in Excel For Each Single-Factor ANOVA Sample Group
- Kruskal-Wallis Test Alternative For Single Factor ANOVA in Excel 2010 and Excel 2013
- Levene’s and Brown-Forsythe Tests in Excel For Single-Factor ANOVA Sample Group Variance Comparison
- Single-Factor ANOVA - All Excel Calculations
- Overview of Post-Hoc Testing For Single-Factor ANOVA
- Tukey-Kramer Post-Hoc Test in Excel For Single-Factor ANOVA
- Games-Howell Post-Hoc Test in Excel For Single-Factor ANOVA
- Overview of Effect Size For Single-Factor ANOVA
- ANOVA Effect Size Calculation Eta Squared (?2) in Excel 2010 and Excel 2013
- ANOVA Effect Size Calculation Psi (?) – RMSSE – in Excel 2010 and Excel 2013
- ANOVA Effect Size Calculation Omega Squared (?2) in Excel 2010 and Excel 2013
- Power of Single-Factor ANOVA Test Using Free Utility G*Power
- Welch’s ANOVA Test in Excel Substitute For Single-Factor ANOVA When Sample Variances Are Not Similar
- Brown-Forsythe F-Test in Excel Substitute For Single-Factor ANOVA When Sample Variances Are Not Similar
- Two-Factor ANOVA With Replication in Excel
- Two-Factor ANOVA With Replication in Excel 2010 and Excel 2013
- Variance Tests: Levene’s and Brown-Forsythe For 2-Factor ANOVA in Excel 2010 and Excel 2013
- Shapiro-Wilk Normality Test in Excel For 2-Factor ANOVA With Replication
- 2-Factor ANOVA With Replication Effect Size in Excel 2010 and Excel 2013
- Excel Post Hoc Tukey’s HSD Test For 2-Factor ANOVA With Replication
- 2-Factor ANOVA With Replication – Test Power With G-Power Utility
- Scheirer-Ray-Hare Test Alternative For 2-Factor ANOVA With Replication
- Two-Factor ANOVA Without Replication in Excel
- Creating Interactive Graphs of Statistical Distributions in Excel
- Interactive Statistical Distribution Graph in Excel 2010 and Excel 2013
- Interactive Graph of the Normal Distribution in Excel 2010 and Excel 2013
- Interactive Graph of the Chi-Square Distribution in Excel 2010 and Excel 2013
- Interactive Graph of the t-Distribution in Excel 2010 and Excel 2013
- Interactive Graph of the Binomial Distribution in Excel 2010 and Excel 2013
- Interactive Graph of the Exponential Distribution in Excel 2010 and Excel 2013
- Interactive Graph of the Beta Distribution in Excel 2010 and Excel 2013
- Interactive Graph of the Gamma Distribution in Excel 2010 and Excel 2013
- Interactive Graph of the Poisson Distribution in Excel 2010 and Excel 2013
- Solving Problems With Other Distributions in Excel
- Solving Uniform Distribution Problems in Excel 2010 and Excel 2013
- Solving Multinomial Distribution Problems in Excel 2010 and Excel 2013
- Solving Exponential Distribution Problems in Excel 2010 and Excel 2013
- Solving Beta Distribution Problems in Excel 2010 and Excel 2013
- Solving Gamma Distribution Problems in Excel 2010 and Excel 2013
- Solving Poisson Distribution Problems in Excel 2010 and Excel 2013
- Optimization With Excel Solver
- Maximizing Lead Generation With Excel Solver
- Minimizing Cutting Stock Waste With Excel Solver
- Optimal Investment Selection With Excel Solver
- Minimizing the Total Cost of Shipping From Multiple Points To Multiple Points With Excel Solver
- Knapsack Loading Problem in Excel Solver – Optimizing the Loading of a Limited Compartment
- Optimizing a Bond Portfolio With Excel Solver
- Travelling Salesman Problem in Excel Solver – Finding the Shortest Path To Reach All Customers
- Chi-Square Population Variance Test in Excel
- Analyzing Data With Pivot Tables
- SEO Functions in Excel
- Time Series Analysis in Excel


Thank you so much for this!!! Very helpful
ReplyDeleteMallory Wood
Really nice.
ReplyDeleteCheers! [A deadline has been made]
ReplyDeleteFantastic post. Am seriously considering buying the entire package.
ReplyDeleteregards
jan/
Really good work...helped a lot....
ReplyDeleteThank you ....
Thank you so much. Very helpful.
ReplyDeleteuda man, test saver
ReplyDeletenice and clear! other blogs are so deep into explaining the equations - this is one of the only ones I've seen that actually helps interpret the output in plain language! thanks!
ReplyDeletevery simply and useful.. thanks
ReplyDeletethank you so much you.... have saved my grade
ReplyDeleteWhy thanks! Really glad you found it useful. :>D
ReplyDeleteReally, really helpful. Thanks!!
ReplyDeleteThanks very much for sharing the knowledge...it was really helpful!
ReplyDeleteWorking on an assignment for class. This helped more than my notes! Thanks!
ReplyDeleteThanks so much, this was easy to understand. A suggestion though...it would be nice to see this same analysis done with something that isn't highly correlated. The contrast would be helpful in finding simple pitfalls.
ReplyDeleteThis is great, thank you! I am familiar with diff. analytics terms but not in too much technical terms, so this is very helpful for me!
ReplyDeleteThank you sooo much. im a psych scholar and this helped me finish my thesis in time!
ReplyDeleteGod bless you!
Thanks a ton buddy...this is really helpful
ReplyDeleteThis was a great help dear, thanks a lot.
ReplyDeleteThanks i found it useful. I am obliged.
ReplyDeleteThank you so much for this information. I've been searching for a while for simple explanations on the regression summary output in Excel and I finally ran across this site. Absolutely a life saver!!
ReplyDeleteFantastic! Very very useful!
ReplyDeleteDoes your text cover Excel 2010?
DeleteAwesome dude. Thanks much
ReplyDeleteThank you very much!!! i had trouble understanding what the figures meant and this was very helpful.
ReplyDeleteThanks a ton !
ReplyDeleteTo the point and simple...Thanks!
ReplyDeleteI concur with pretty much everyone who has commented before me...very useful.....thank you
ReplyDeleteis there any one help me to say what is the menaing of p value 0.20
ReplyDeleteĐặt vé tại phòng vé Aivivu, tham khảo
ReplyDeletevé máy bay đi Mỹ giá rẻ
ve may bay tu my ve vietnam
các chuyến bay từ narita về hà nội
vé máy bay từ đức về sài gòn
vé máy bay từ Toronto về việt nam
vé máy bay từ hàn quốc sang việt nam
danh sách khách sạn cách ly tại quảng ninh
vé máy bay chuyên gia nước ngoài sang Việt Nam